What are the prevalent needs in the community and in what areas do we find the highest need?
Santa Cruz Community Data Mapping Project
Santa Cruz County, as one community, is in good standing compared to most counties in California. However, the socioeconomic status or quality of life of a family or an individual varies depending on where they reside. The Community Data Mapping Project enabled the community to access a comprehensive countywide data pool online and a detailed analysis of community needs. The project brought various socioeconomic and demographic indicators together and enabled community users to identify needs by location and geographic patterns. Identifying needs in a geographical context encourages service/resource distributions pertinent to each region or area’s socioeconomic needs.
In our work with Santa Cruz, three unique regions were identified within the county by partners and Healthy City. Our analysis showed that there were racial/ethnic, age, and population differences within those regions. Furthermore, the analysis showed unique needs for each region around financial, safety, health, and education needs.
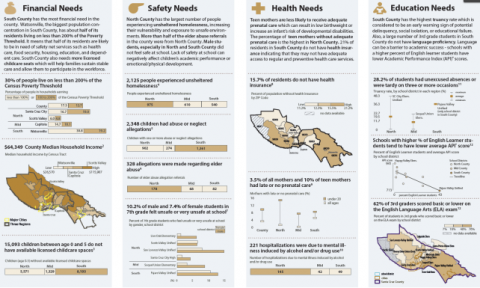
Our analysis showed that half the residents in South County were likely to be in need of safety net services such as health care, food security, housing, education, and dependent care.
Additionally, North County had the largest number of people experiencing unsheltered homelessness, increasing their vulnerability and exposure to unsafe environments. The percentage of teen mothers without adequate prenatal care was highest in North County. South County had the highest truancy rate, which is considered to be an early warning sign of potential delinquency, social isolation, or educational failure.
We used this new knowledge to engage the community.
In order to share our data throughout the region and disseminate key findings, we hosted a community event with key stakeholders from government, non-profit, and community leaders to maximize our reach and to get the whole region excited about the data. We supplemented this community event with trainings throughout the area to support community usage of the data on Healthycity.org. A report summary was also developed that allowed for a quick overview of the research question and contained impactful visuals of the highest need regions.