Redistricting: Equity Indicators
Redistricting Equity Indicators are data that have been selected by the IVE Redistricting Alliance (Statewide) and the People's Bloc (Los Angeles County). These data are available to support our goals of moving towards a more equitable California by creating districts that ensure people of color and equity-minded community members are able to elect candidates of choice.
Equity Indicators can be used to support:
- Community conversations around multiple ways to define their communities of interest (COI).
- Identification of common social or cultural interests or progressive policy goals across neighborhoods.
- Assessment of proposed districts regarding their potential to maximize opportunities for low income and people of color to advance progressive policies that benefit them.
- Statewide (IVE Redistricting Alliance)
- Los Angeles County (People's Bloc) Note: These data (i.e. data from the American Community Survey and other sources) are for reference only--for example, for the creation of COIs--and should not be used to draw actual district lines. Only the Decennial Census PL 94-171 data should be used to draw district lines.
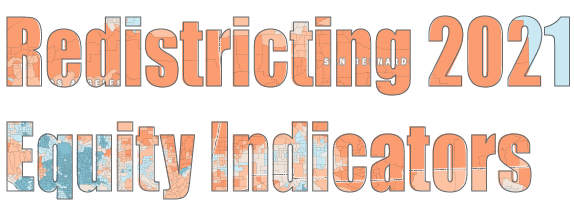
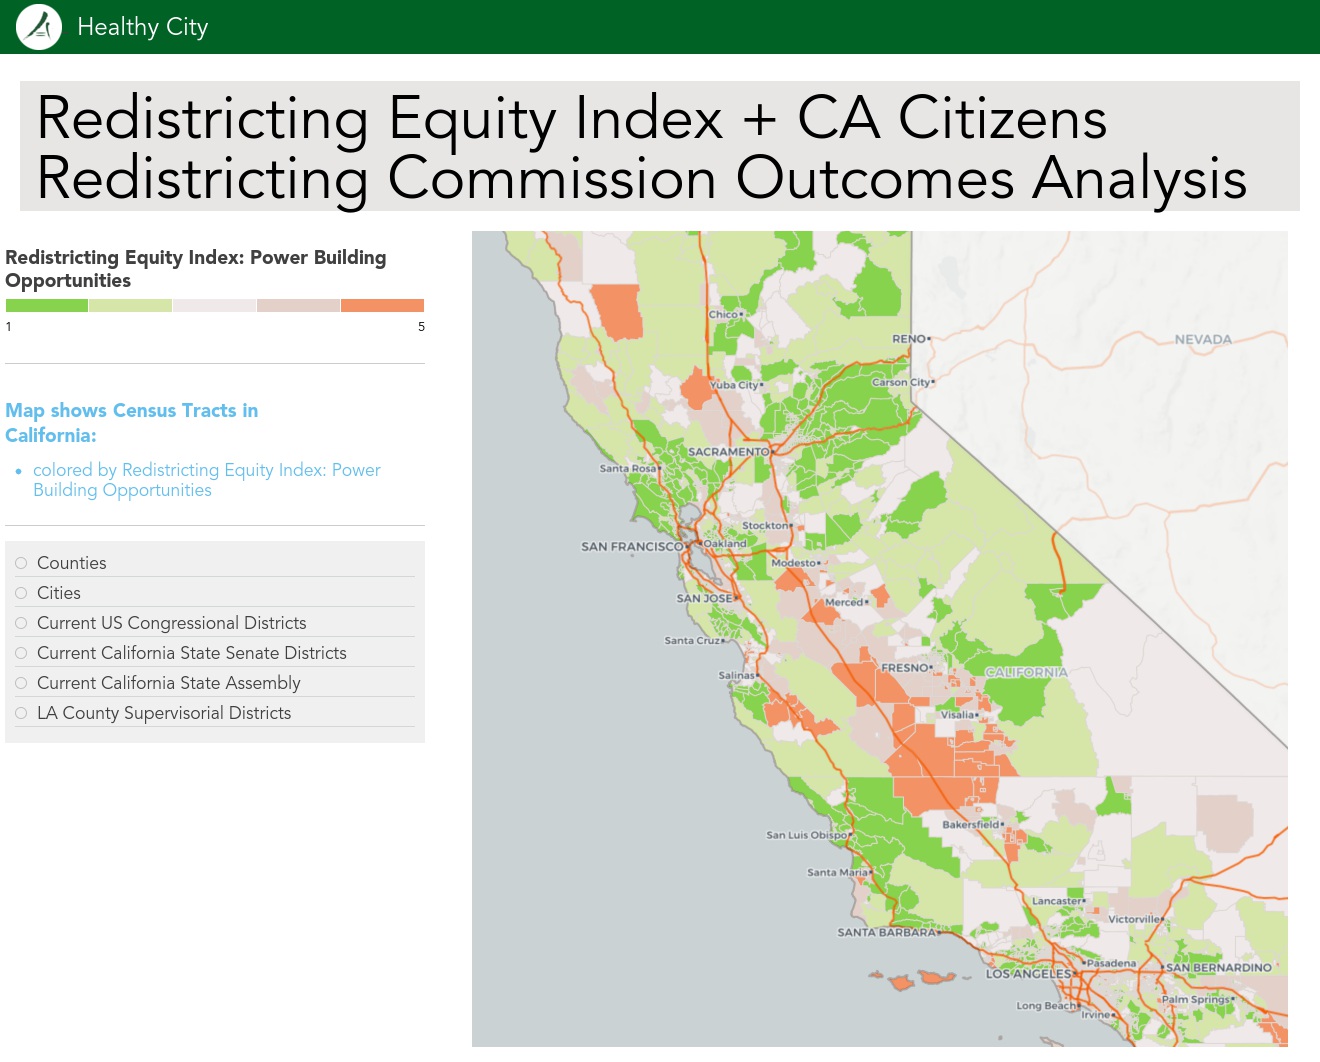
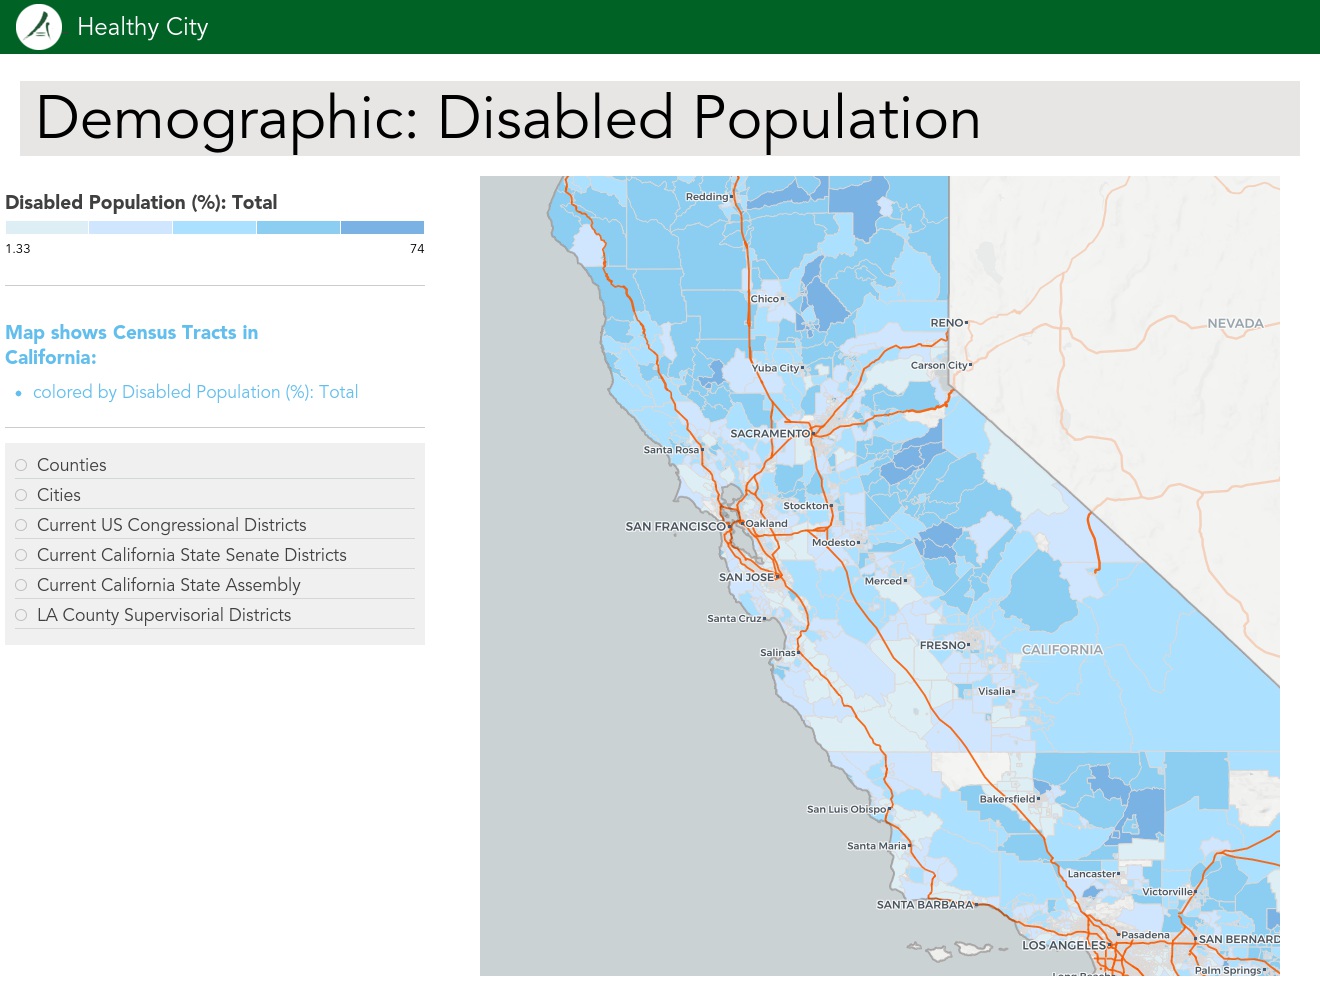
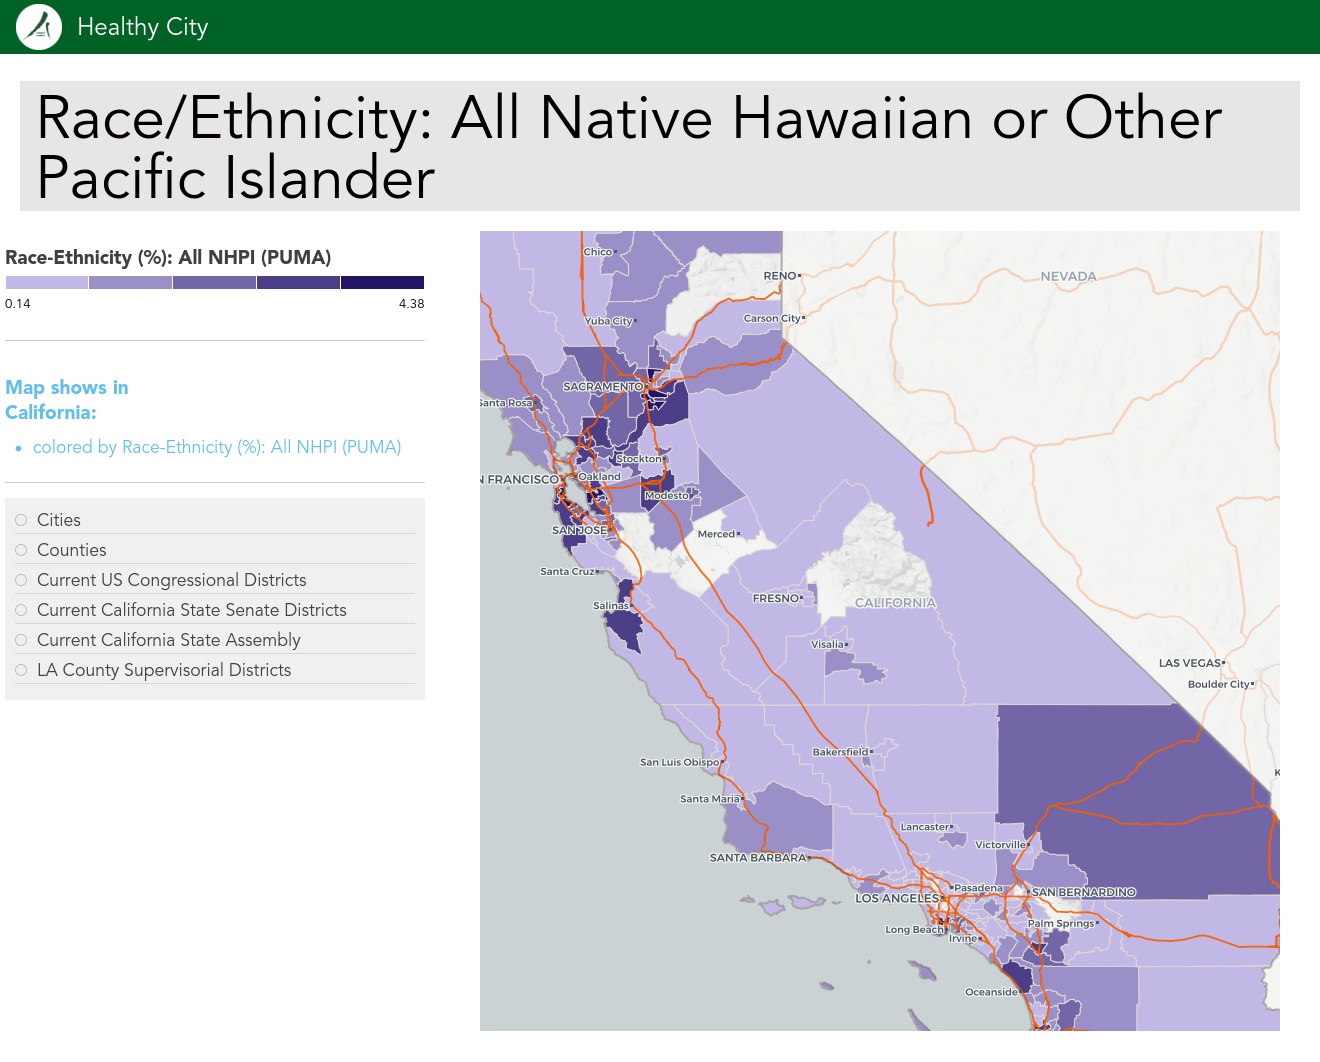
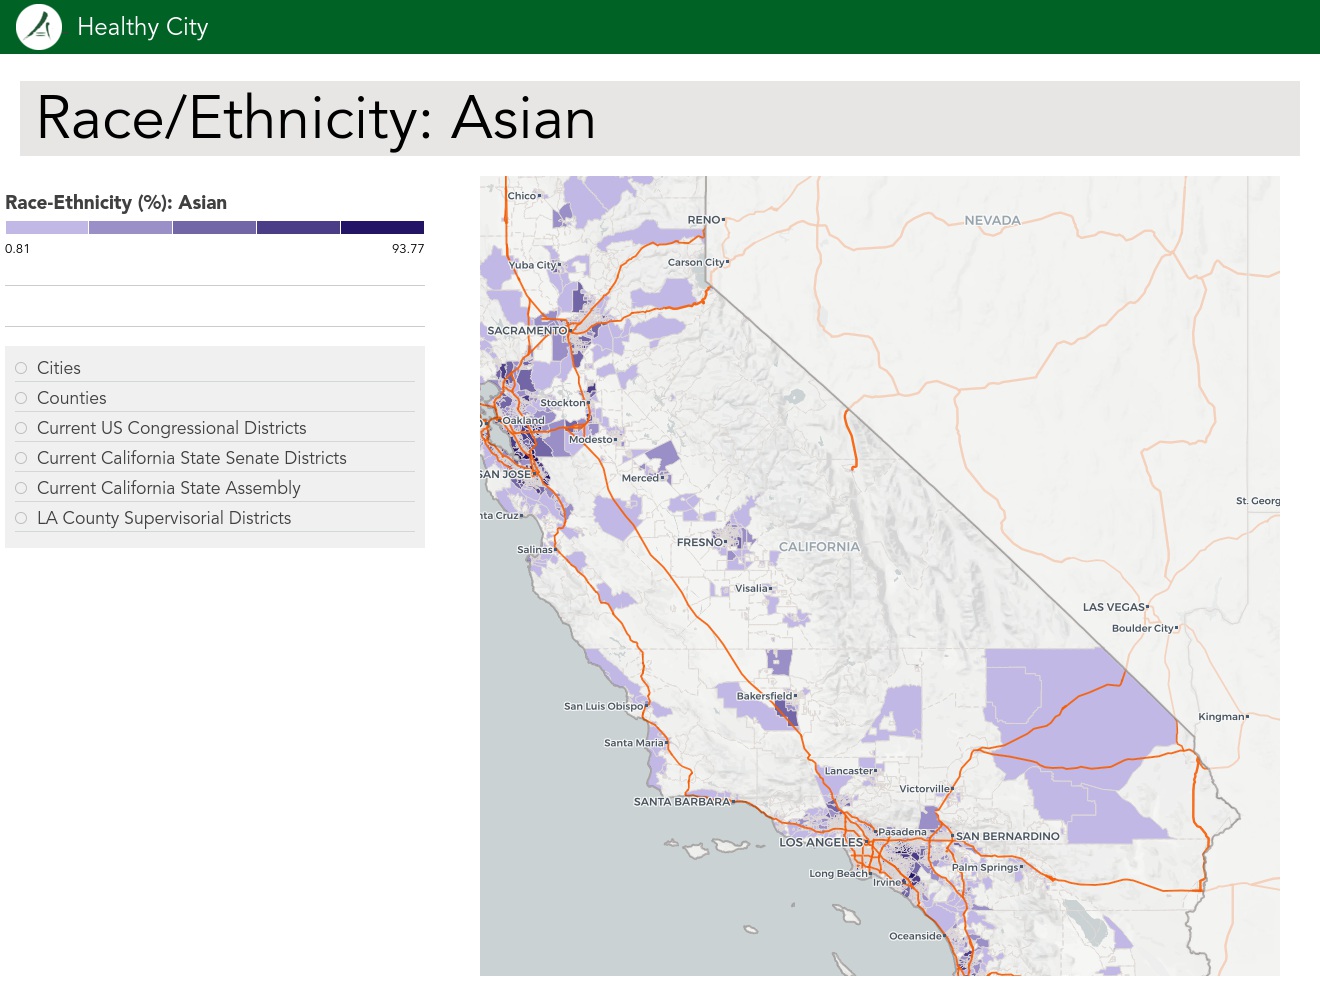
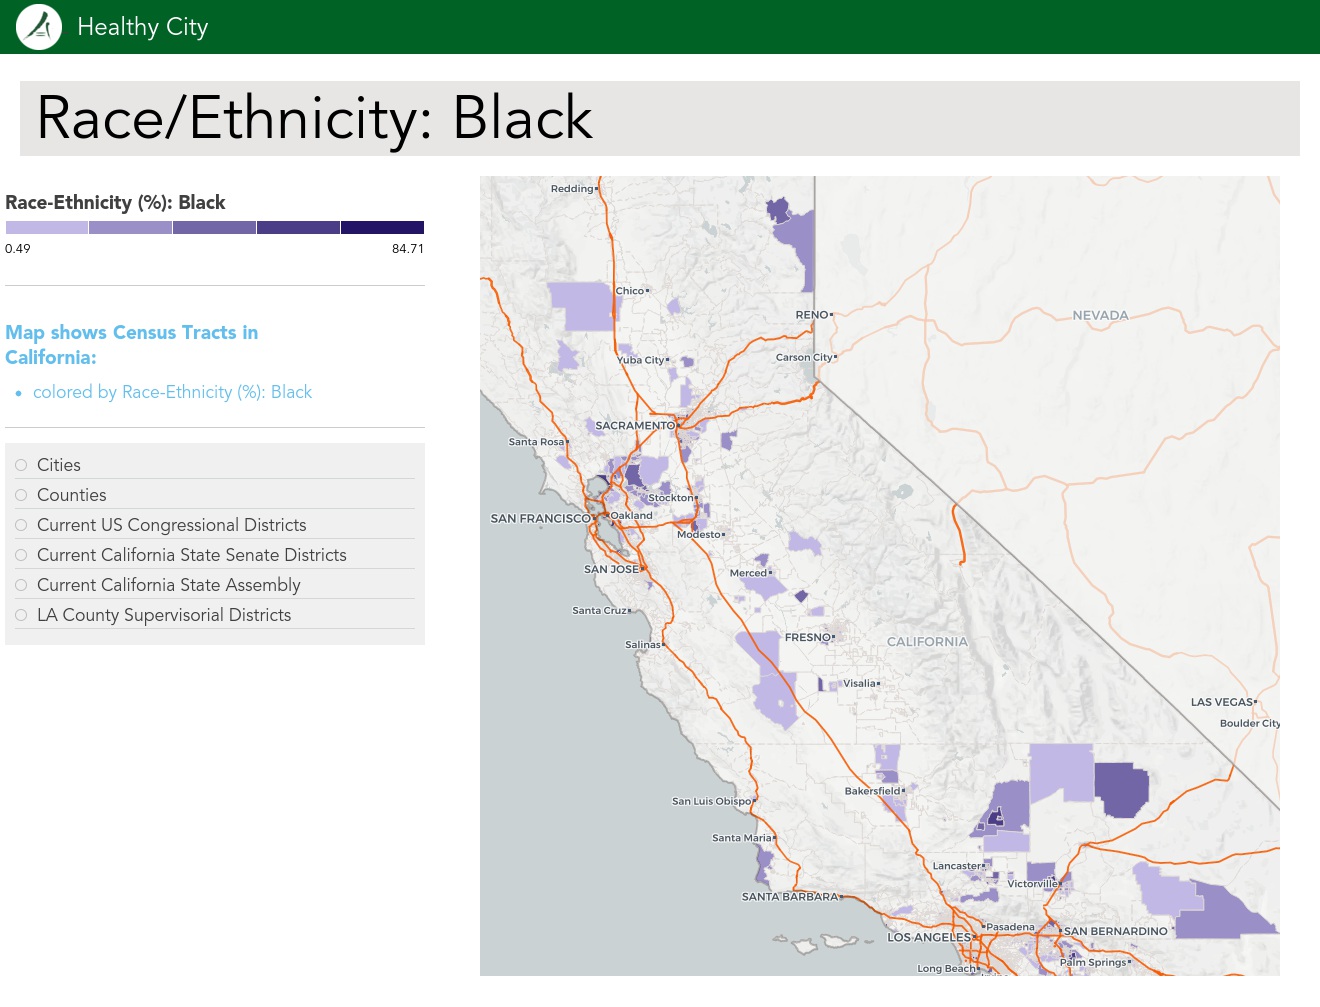
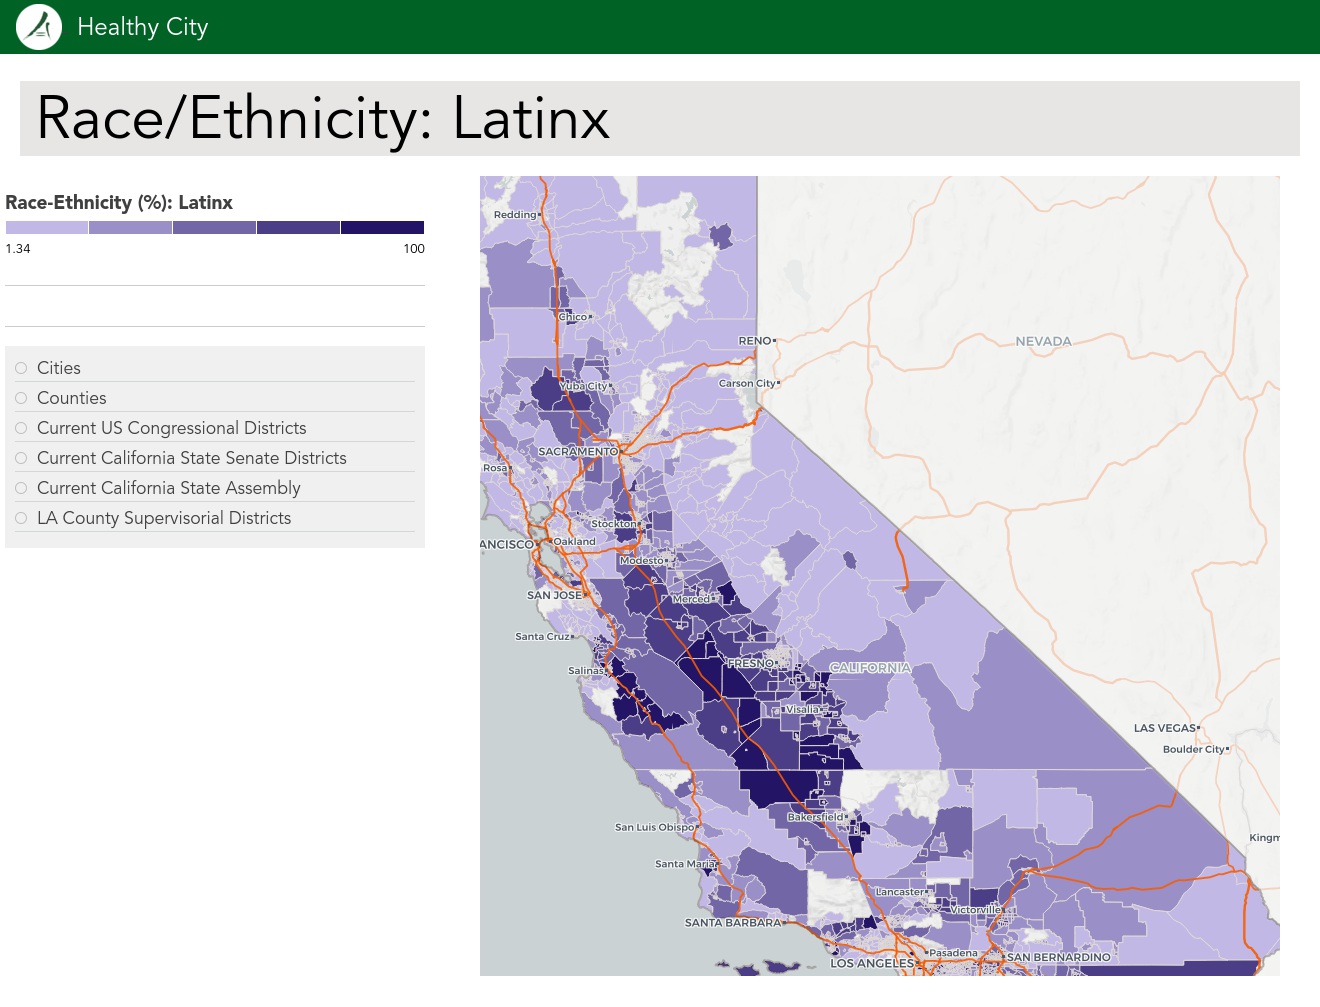
MAPS
Click to explore interactive maps with curated data and downloadable map images.
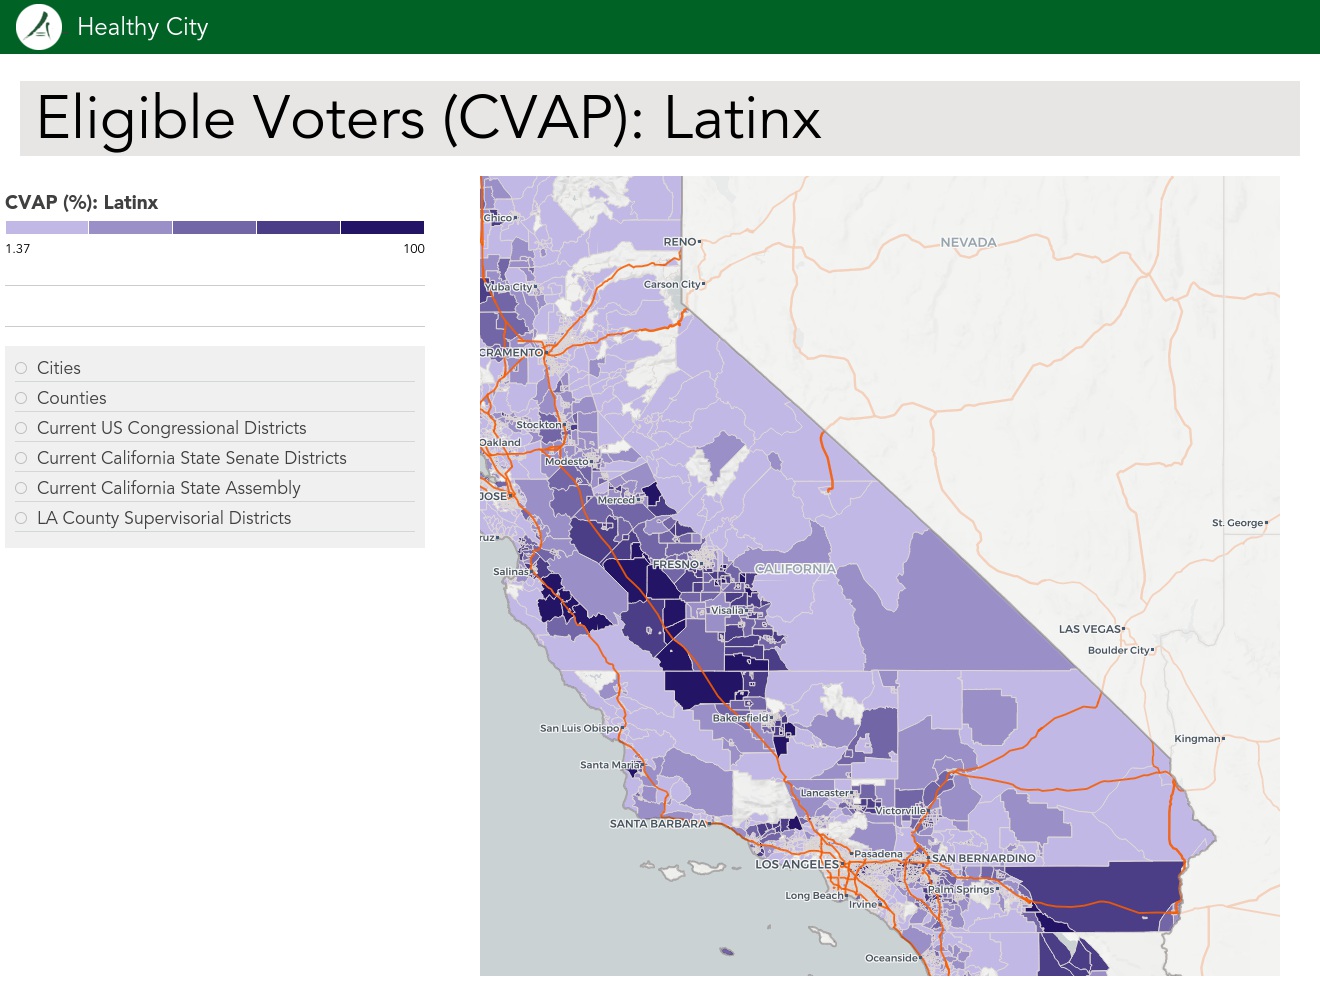

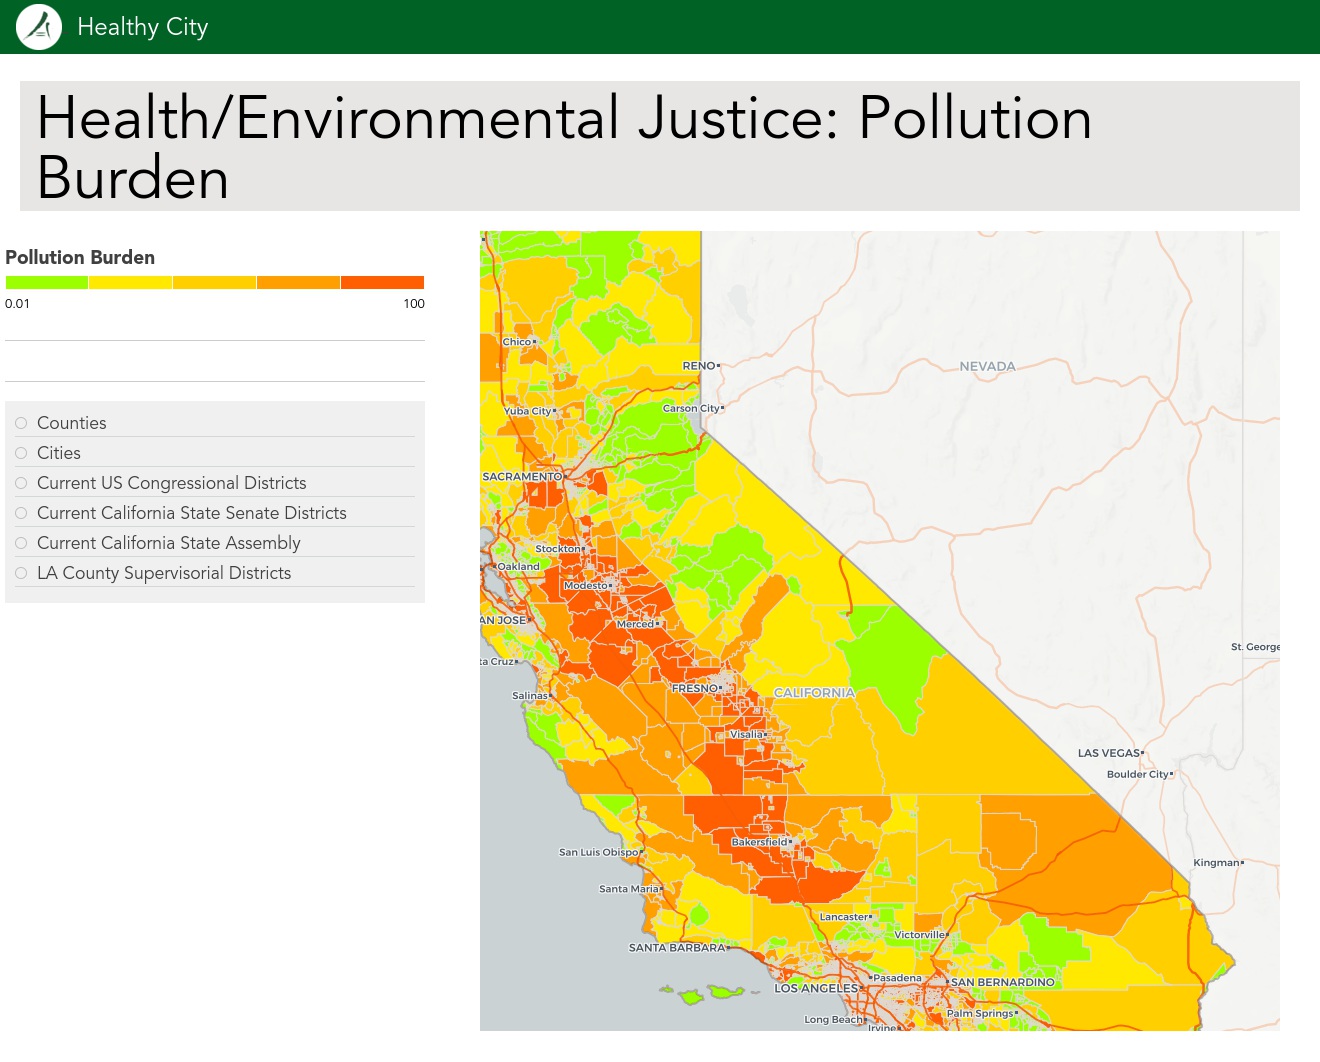

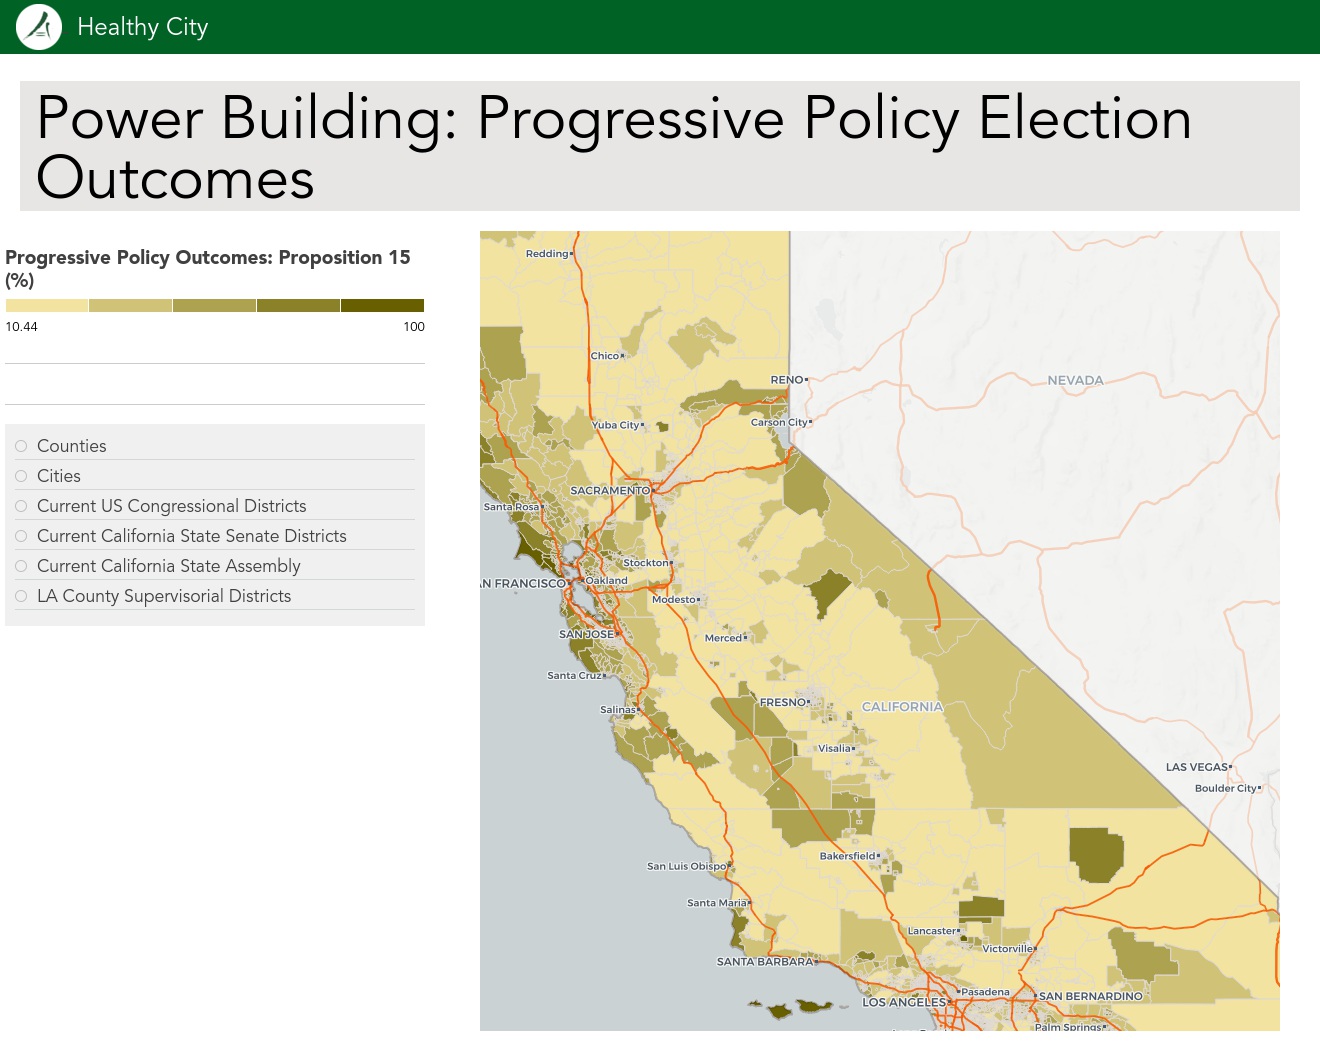
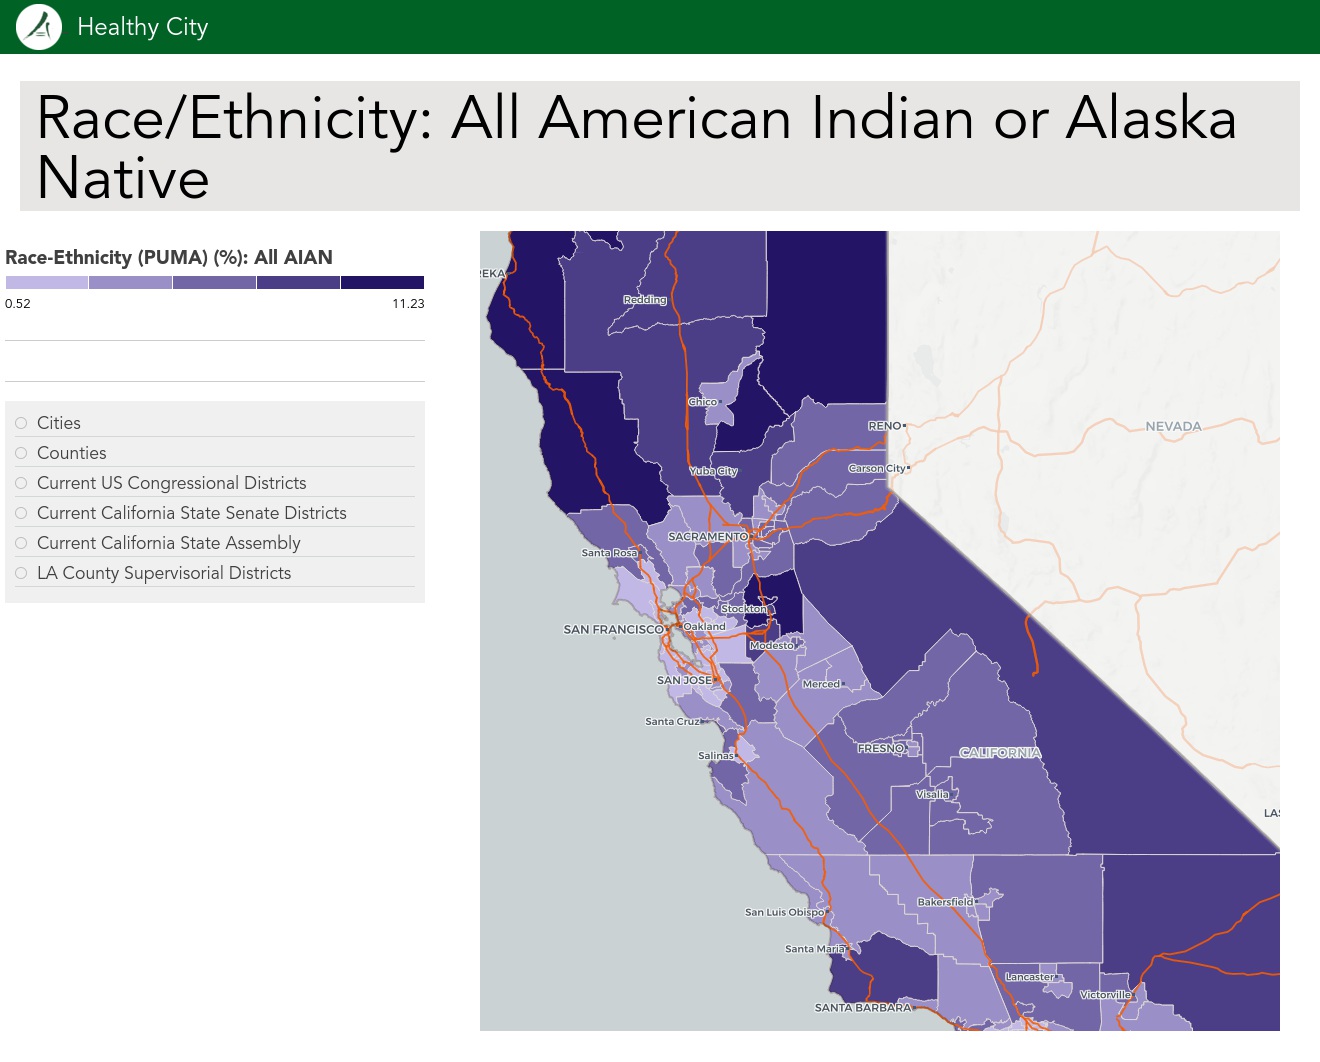
DATA
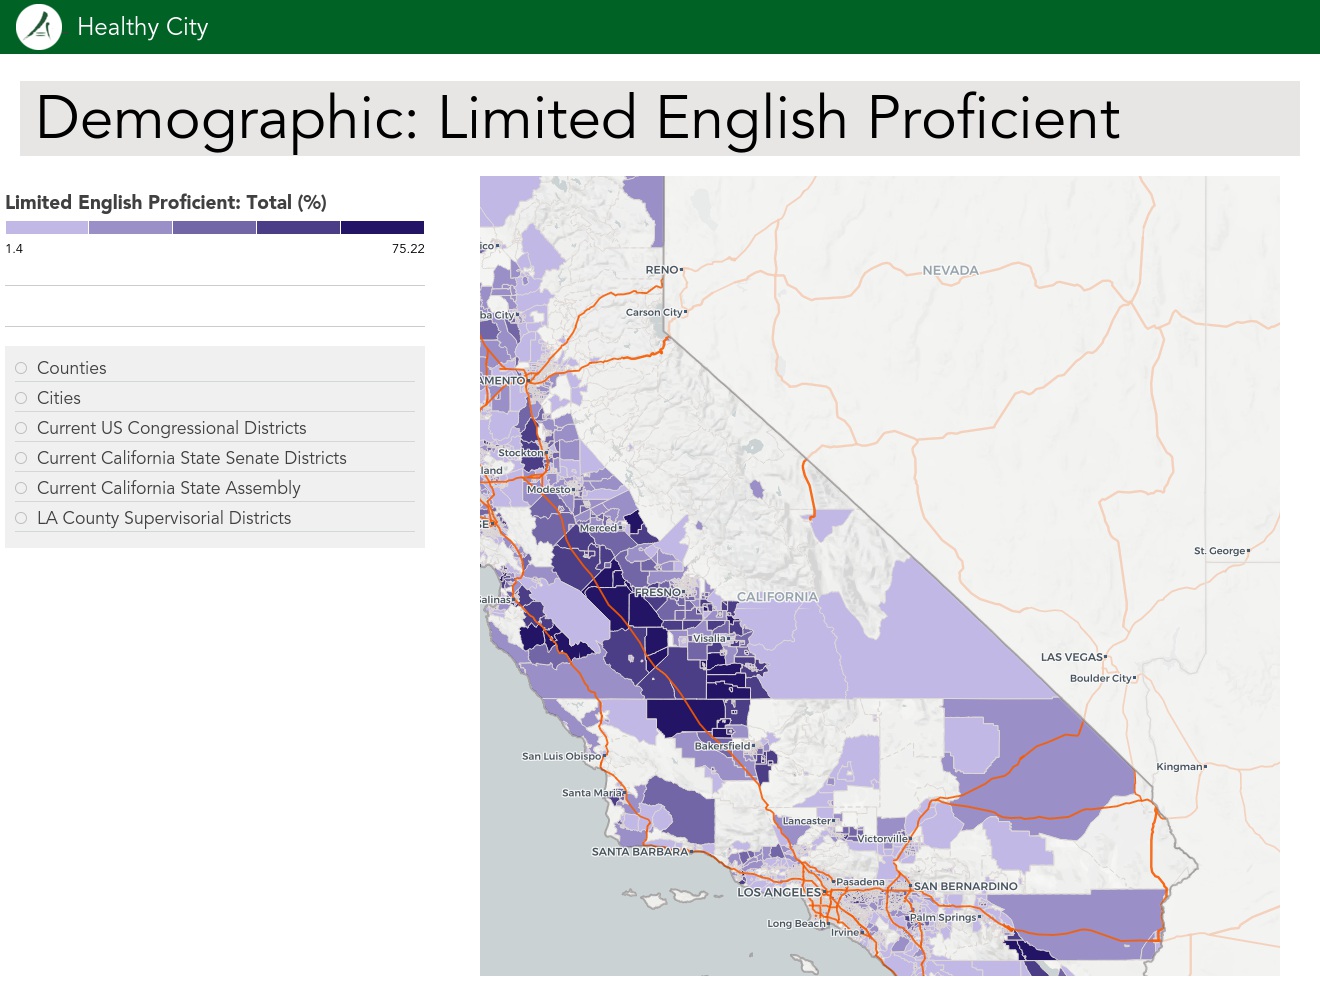
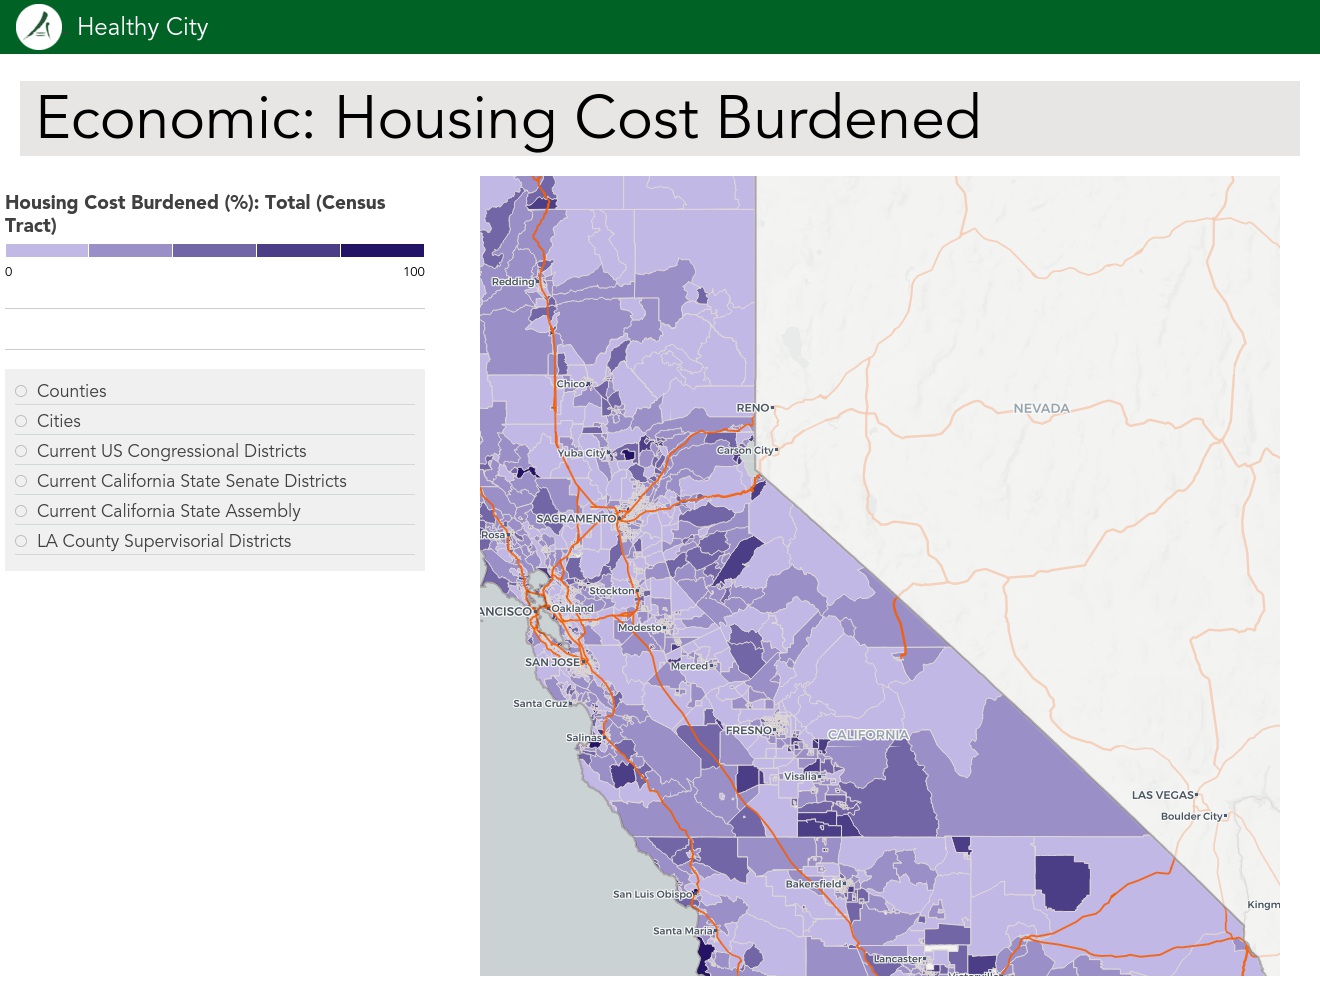
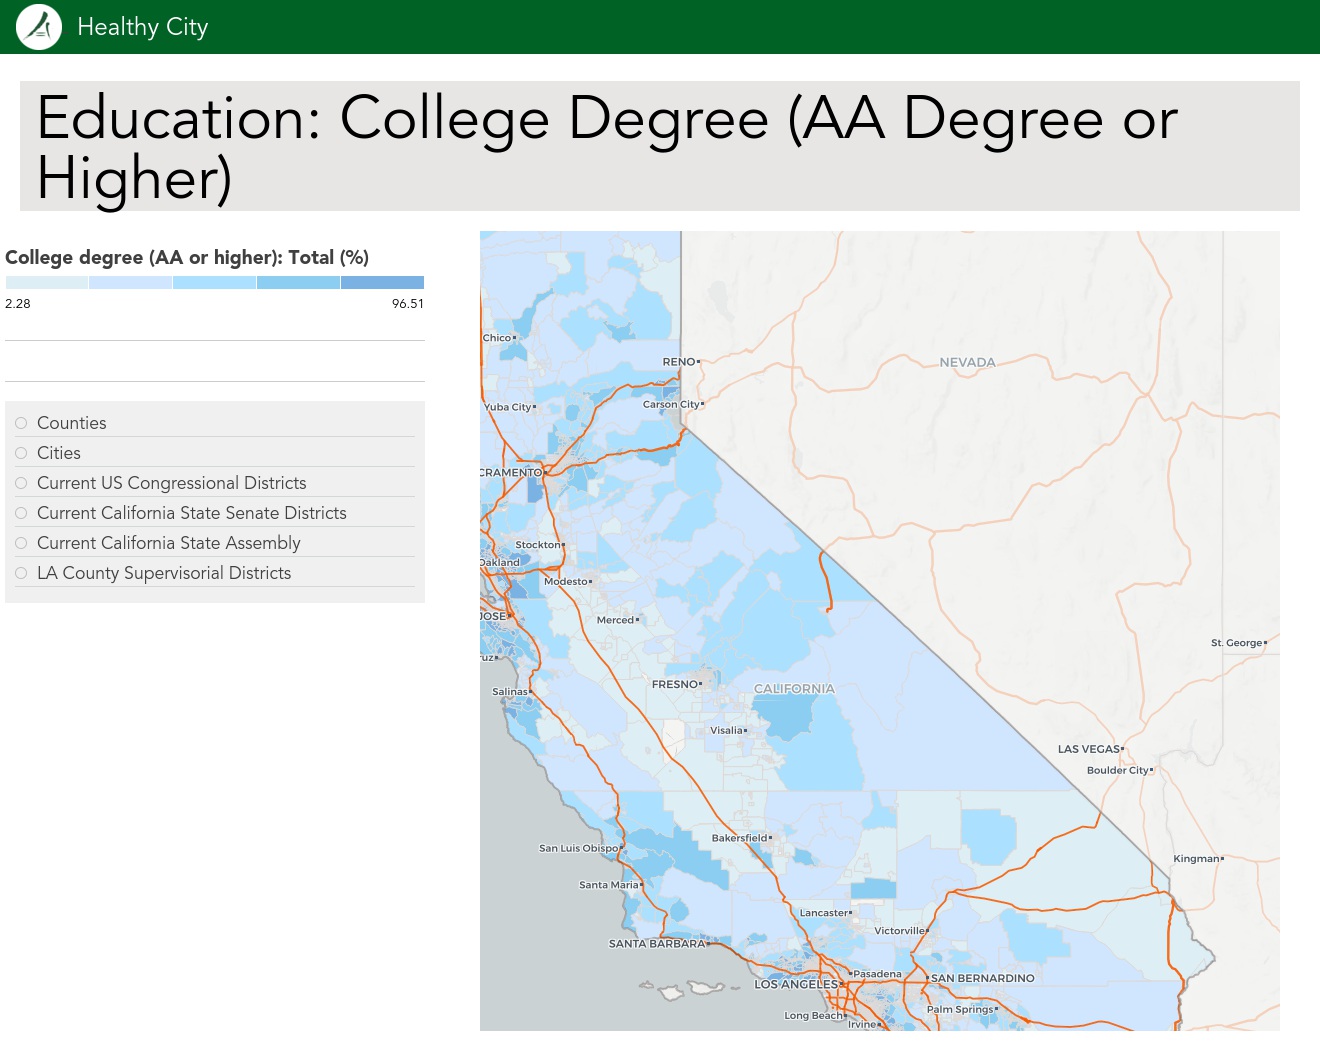
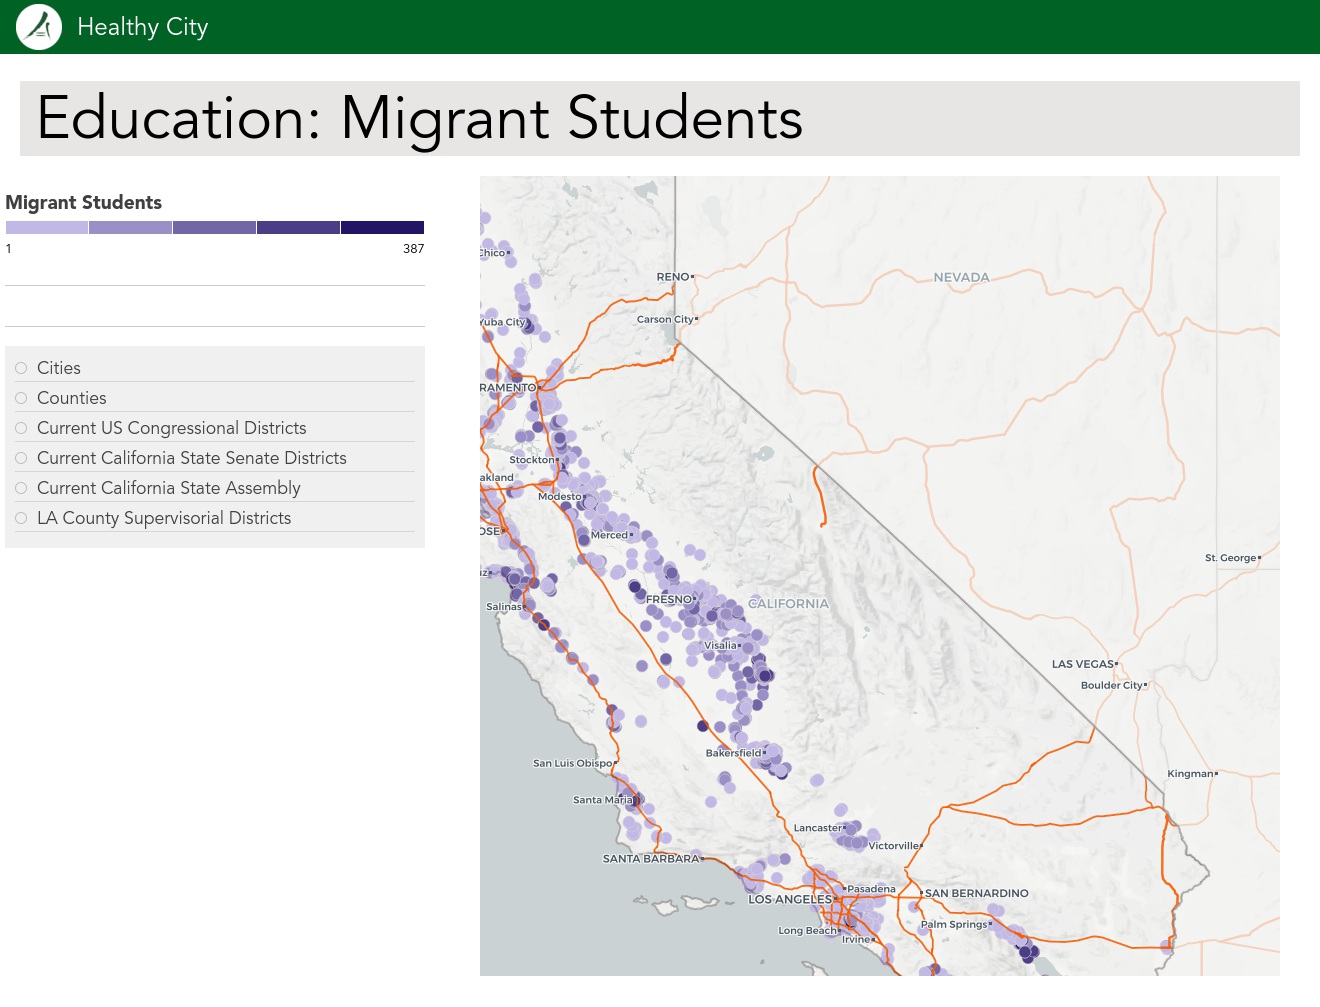
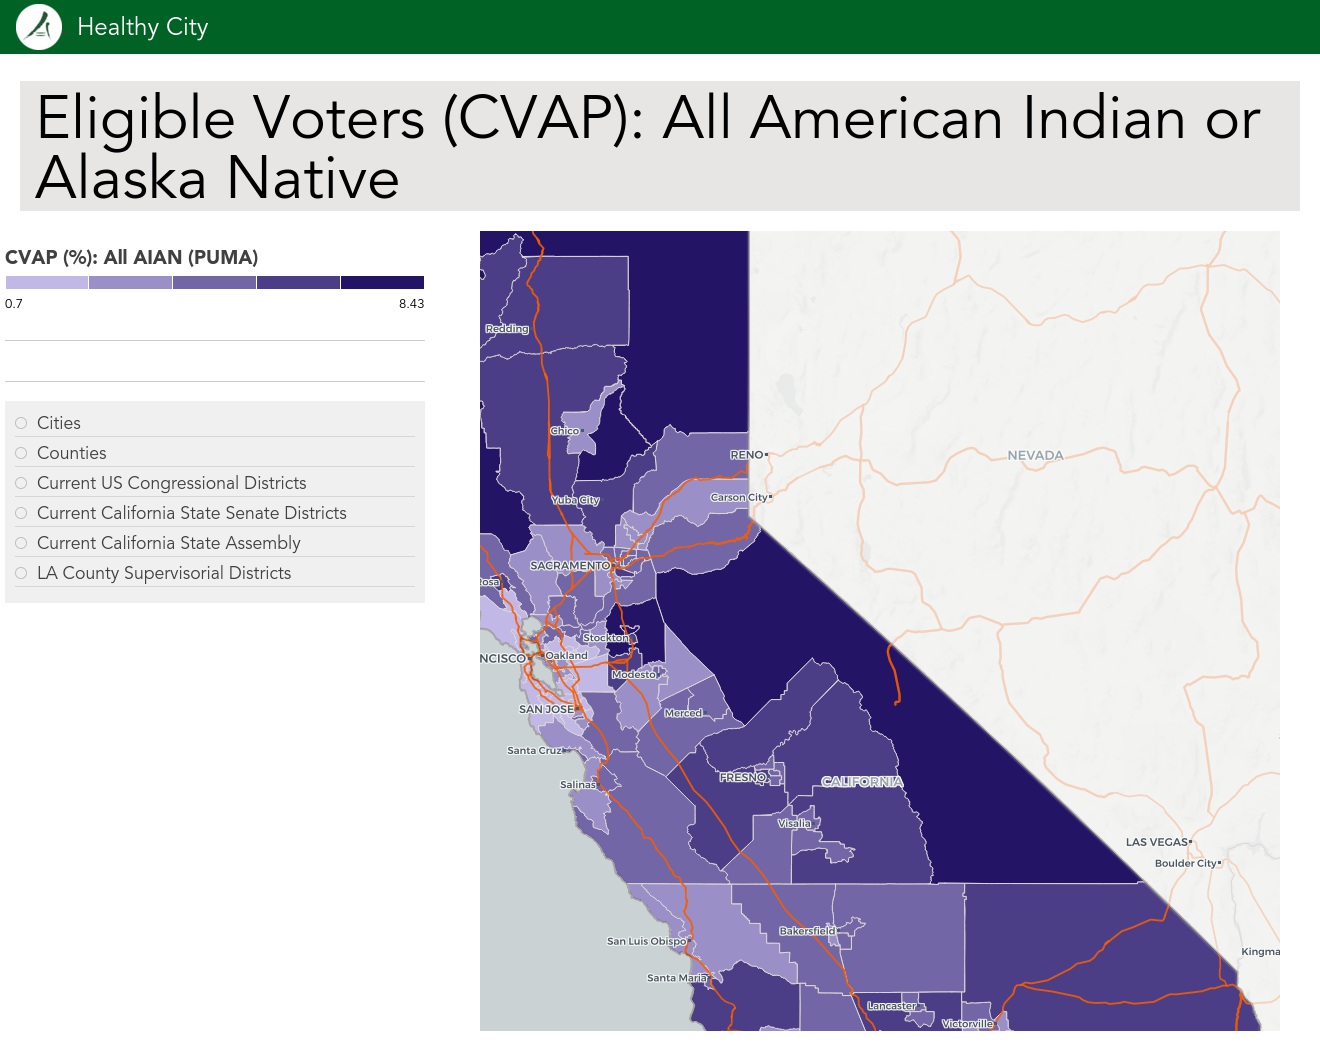
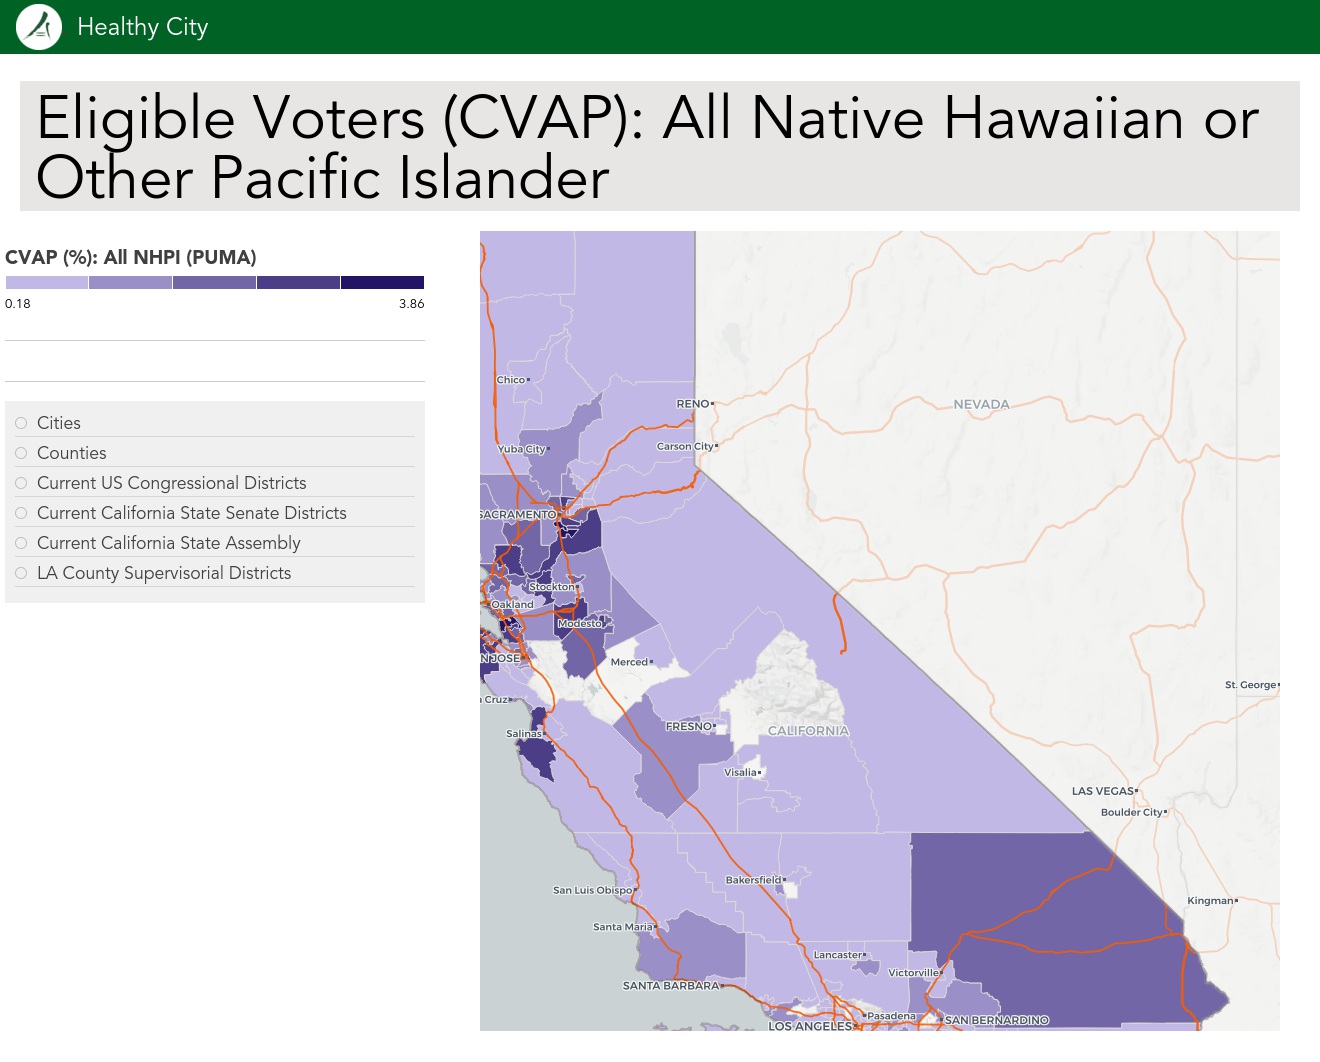
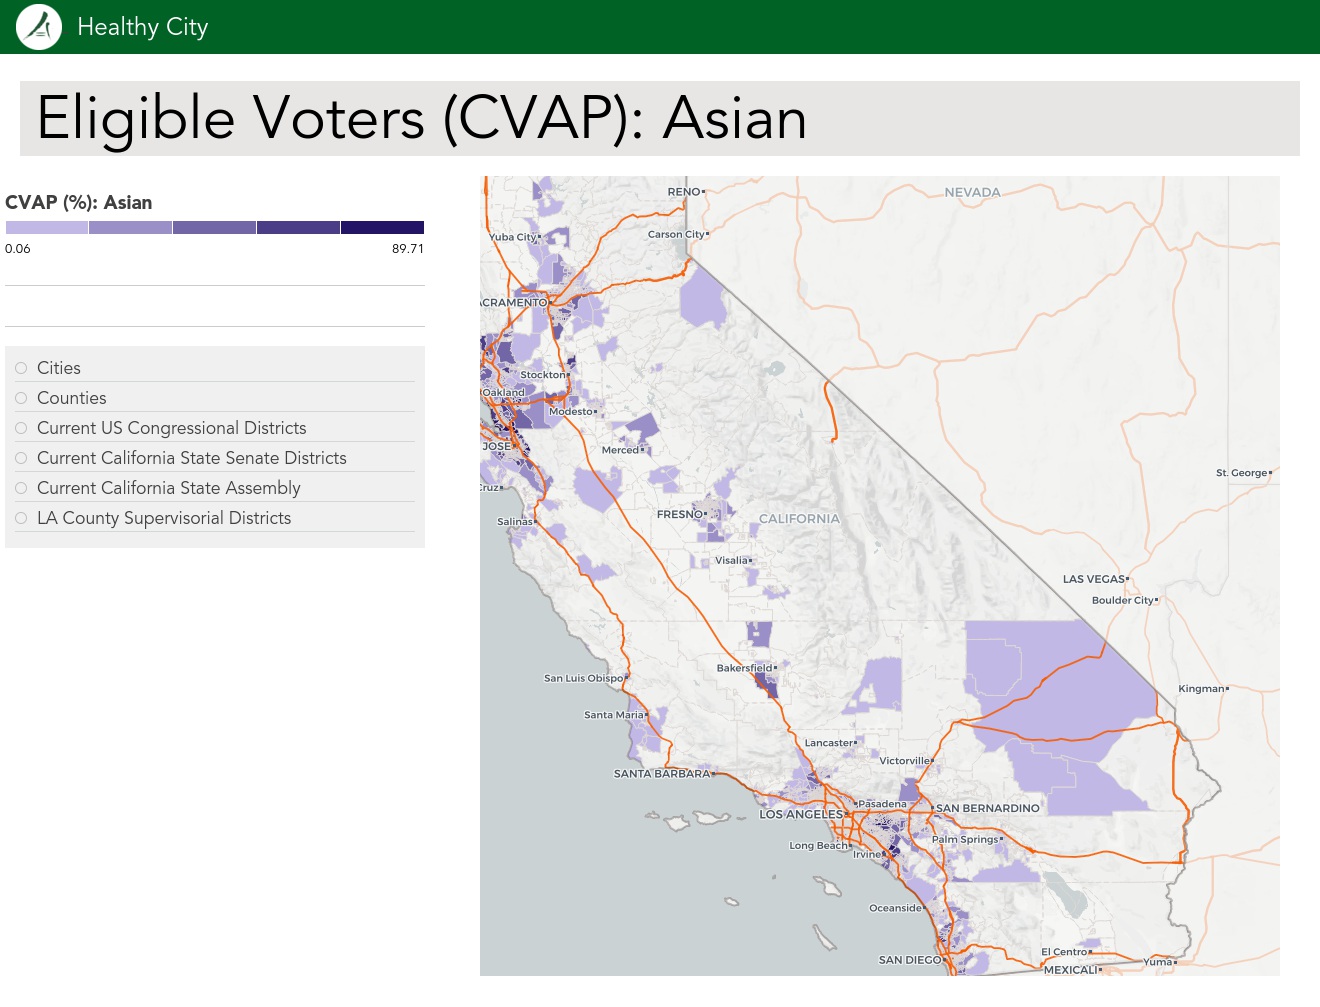
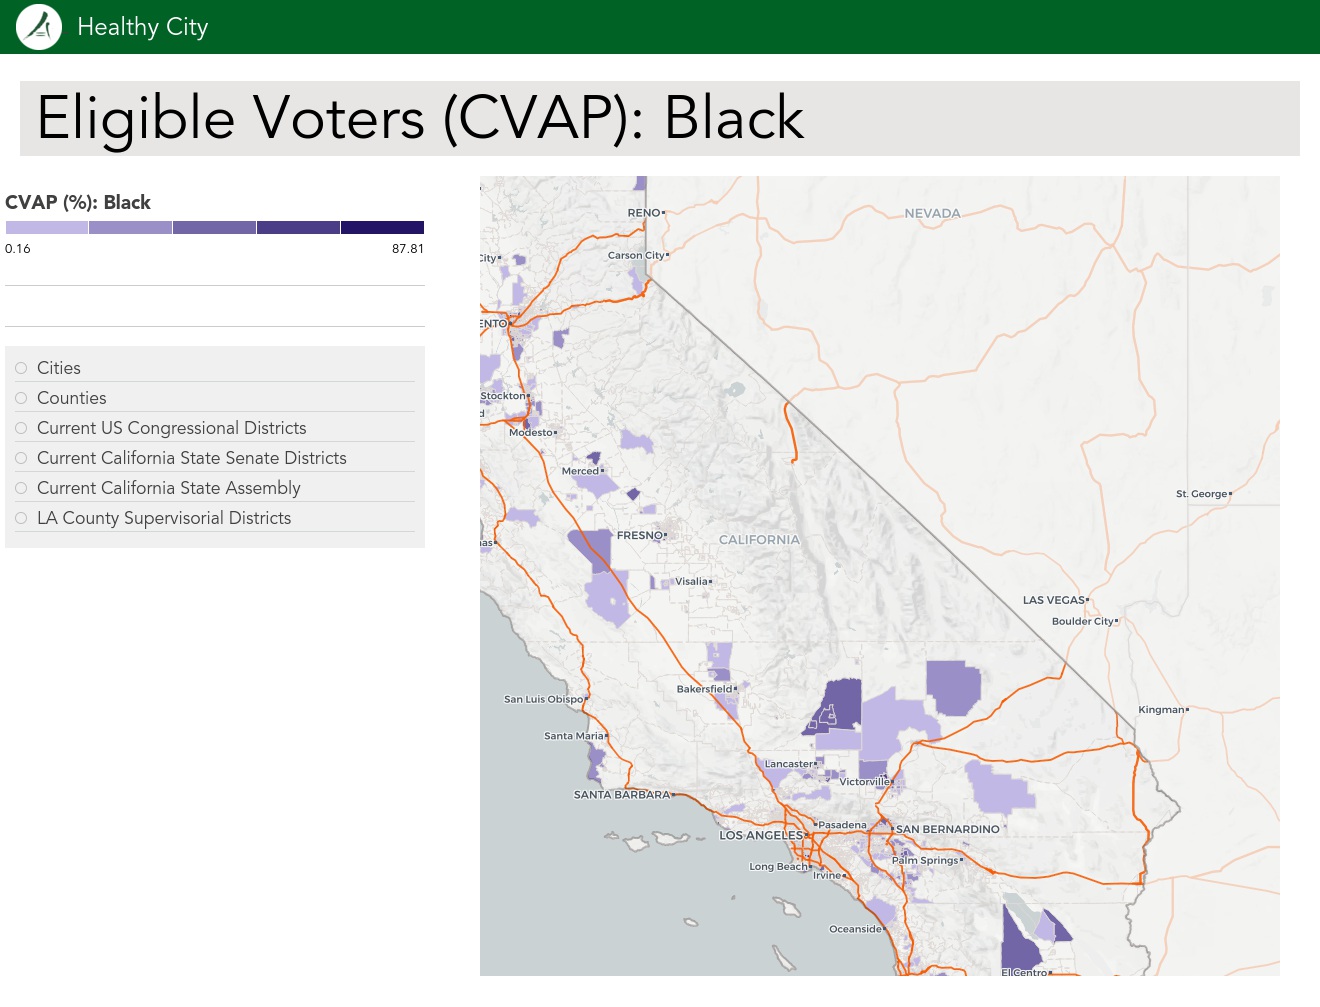
Select a category and indicator to preview data on the map below.
Category
Indicator
College degree (AA or higher): Total (%)